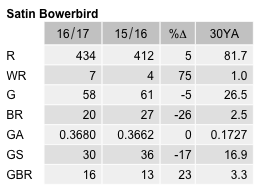
Satin Bowerbird
Ptilonorhynchus violaceus
ABR description
The following is extracted from the Annual Bird Report for the twelve months to June 2017.
Common, breeding resident
An inhabitant of wet forests, now regularly observed in Canberra suburbs.
General: Slightly fewer birds than last year (789 cf 839). Records still mainly from numerous sites in and around Canberra with a few from the Brindabellas. Reporting rate (3.2%) is a little lower than last year, and just over than the 10YA and the 30YA. Abundance is down 22% on last year after increasing for the previous 4 years. Mean 1.8, median 1, max 19/16 Aug Wee Jasper valley GrA09 (DaC2). 22 breeding records (27 last year) which was the largest number recorded, from dy/1 Jul Mt Majura (CnM1) to dy/6 Jan The Pinnacle NR (AlB1), with some early showing off with di/13 May Warrina Inlet/Westbourne Woods (NeG1).
GBS: 448 records (403 last year) from 30 sites from all weeks. Abundance up slightly from last year, 60% more than the 10YA and 113% more than the 30YA. The A value for this species has plateaued after 8 years of significant growth. 163 breeding records from 4 sites – many more than the 10YA (6.9) and the 30YA (3.3) – from dy/1wk Jul Yarralumla (NeG1) to dy/1wk Mar Curtin (AjR1), with an early start for next season di/4wk Jun Yarralumla GrK14 (NeG1).
Abundance
Abundance is the average number of birds of that species per survey. Where the species was observed (presence recorded) but the number of birds seen was not recorded, this is treated as a count of zero.
Abundance by year
This chart shows the abundance of Satin Bowerbird between 1982 and 2017. 
Abundance by month
This chart shows the monthly abundance of Satin Bowerbird. The blue lines show the abundance for the twelve months to June 2017 and the bars show the average abundance for the period 1982 to 2017. 
Abundance by season
This chart shows the seasonal abundance of Satin Bowerbird. The blue lines show the seasonal abundance for the twelve months to June 2017 and the bars show the average seasonal abundance for the period 1982 to 2017. 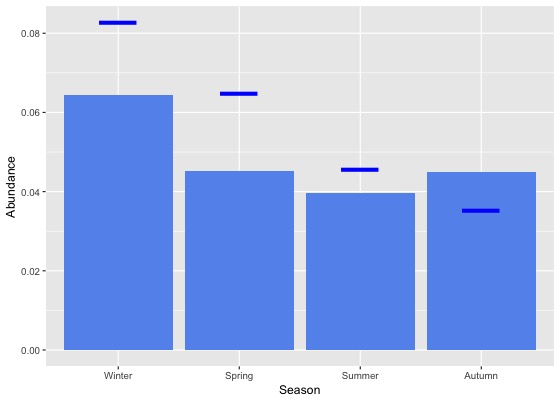
Abundance data
| Month | Season | ||||||||||||||||||
|---|---|---|---|---|---|---|---|---|---|---|---|---|---|---|---|---|---|---|---|
| Period | Jul | Aug | Sep | Oct | Nov | Dec | Jan | Feb | Mar | Apr | May | Jun | Winter | Spring | Summer | Autumn | All | ||
| All years | |||||||||||||||||||
| All | 0.1 | 0.1 | 0.0 | 0.1 | 0.0 | 0.0 | 0.0 | 0.0 | 0.0 | 0.0 | 0.1 | 0.1 | 0.1 | 0.0 | 0.0 | 0.0 | 0.0 | ||
| Previous years | |||||||||||||||||||
| All previous years | 0.1 | 0.1 | 0.0 | 0.1 | 0.0 | 0.0 | 0.0 | 0.0 | 0.0 | 0.0 | 0.1 | 0.0 | 0.1 | 0.0 | 0.0 | 0.0 | 0.0 | ||
| Previous 30 years | 0.1 | 0.1 | 0.0 | 0.1 | 0.0 | 0.0 | 0.0 | 0.0 | 0.0 | 0.0 | 0.1 | 0.0 | 0.1 | 0.0 | 0.0 | 0.0 | 0.0 | ||
| Previous 20 years | 0.1 | 0.1 | 0.0 | 0.1 | 0.0 | 0.0 | 0.0 | 0.1 | 0.0 | 0.0 | 0.1 | 0.1 | 0.1 | 0.0 | 0.0 | 0.0 | 0.0 | ||
| 10 year groups | |||||||||||||||||||
| [2007,2017) | 0.1 | 0.1 | 0.0 | 0.1 | 0.0 | 0.0 | 0.0 | 0.1 | 0.0 | 0.0 | 0.1 | 0.1 | 0.1 | 0.1 | 0.0 | 0.1 | 0.1 | ||
| [1997,2007) | 0.1 | 0.0 | 0.0 | 0.0 | 0.0 | 0.0 | 0.0 | 0.0 | 0.0 | 0.0 | 0.1 | 0.0 | 0.0 | 0.0 | 0.0 | 0.0 | 0.0 | ||
| [1987,1997) | 0.1 | 0.0 | 0.1 | 0.0 | 0.0 | 0.0 | 0.0 | 0.0 | 0.0 | 0.0 | 0.1 | 0.0 | 0.1 | 0.0 | 0.0 | 0.0 | 0.0 | ||
| 5 year groups | |||||||||||||||||||
| [2012,2017) | 0.1 | 0.1 | 0.0 | 0.1 | 0.0 | 0.0 | 0.1 | 0.1 | 0.0 | 0.1 | 0.1 | 0.1 | 0.1 | 0.1 | 0.0 | 0.1 | 0.1 | ||
| [2007,2012) | 0.1 | 0.1 | 0.0 | 0.1 | 0.0 | 0.0 | 0.0 | 0.1 | 0.0 | 0.0 | 0.0 | 0.0 | 0.0 | 0.0 | 0.0 | 0.0 | 0.0 | ||
| [2002,2007) | 0.0 | 0.0 | 0.0 | 0.0 | 0.0 | 0.0 | 0.0 | 0.0 | 0.0 | 0.0 | 0.0 | 0.0 | 0.0 | 0.0 | 0.0 | 0.0 | 0.0 | ||
| [1997,2002) | 0.1 | 0.0 | 0.0 | 0.0 | 0.0 | 0.0 | 0.0 | 0.0 | 0.0 | 0.0 | 0.1 | 0.0 | 0.0 | 0.0 | 0.0 | 0.0 | 0.0 | ||
| [1992,1997) | 0.1 | 0.0 | 0.1 | 0.0 | 0.0 | 0.0 | 0.0 | 0.0 | 0.0 | 0.0 | 0.1 | 0.0 | 0.0 | 0.0 | 0.0 | 0.1 | 0.0 | ||
| [1987,1992) | 0.1 | 0.1 | 0.1 | 0.0 | 0.1 | 0.0 | 0.0 | 0.1 | 0.0 | 0.0 | 0.0 | 0.0 | 0.1 | 0.1 | 0.0 | 0.0 | 0.1 | ||
| Year | |||||||||||||||||||
| 2017 | 0.1 | 0.1 | 0.1 | 0.1 | 0.1 | 0.0 | 0.1 | 0.0 | 0.0 | 0.0 | 0.0 | 0.1 | 0.1 | 0.1 | 0.0 | 0.0 | 0.1 | ||
| 2016 | 0.2 | 0.1 | 0.1 | 0.1 | 0.0 | 0.0 | 0.0 | 0.1 | 0.0 | 0.0 | 0.1 | 0.1 | 0.1 | 0.1 | 0.0 | 0.1 | 0.1 | ||
| 2015 | 0.1 | 0.1 | 0.1 | 0.1 | 0.1 | 0.0 | 0.1 | 0.1 | 0.1 | 0.1 | 0.1 | 0.1 | 0.1 | 0.1 | 0.1 | 0.1 | 0.1 | ||
| 2014 | 0.1 | 0.0 | 0.0 | 0.1 | 0.0 | 0.0 | 0.1 | 0.0 | 0.1 | 0.1 | 0.1 | 0.1 | 0.1 | 0.1 | 0.1 | 0.1 | 0.1 | ||
| 2013 | 0.1 | 0.1 | 0.0 | 0.1 | 0.0 | 0.0 | 0.0 | 0.1 | 0.0 | 0.0 | 0.1 | 0.1 | 0.1 | 0.0 | 0.0 | 0.0 | 0.0 | ||
| 2012 | 0.0 | 0.1 | 0.0 | 0.0 | 0.0 | 0.0 | 0.0 | 0.0 | 0.0 | 0.1 | 0.1 | 0.1 | 0.0 | 0.0 | 0.0 | 0.0 | 0.0 | ||
| 2011 | 0.0 | 0.2 | 0.1 | 0.0 | 0.0 | 0.0 | 0.0 | 0.1 | 0.0 | 0.0 | 0.1 | 0.0 | 0.0 | 0.0 | 0.0 | 0.0 | 0.0 | ||
| 2010 | 0.2 | 0.0 | 0.0 | 0.1 | 0.0 | 0.0 | 0.0 | 0.1 | 0.0 | 0.0 | 0.1 | 0.0 | 0.0 | 0.1 | 0.0 | 0.0 | 0.0 | ||
| 2009 | 0.0 | 0.1 | 0.0 | 0.1 | 0.0 | 0.0 | 0.1 | 0.1 | 0.0 | 0.0 | 0.0 | 0.0 | 0.0 | 0.1 | 0.0 | 0.0 | 0.0 | ||
| 2008 | 0.1 | 0.0 | 0.0 | 0.0 | 0.0 | 0.1 | 0.1 | 0.0 | 0.0 | 0.0 | 0.0 | 0.0 | 0.0 | 0.0 | 0.1 | 0.0 | 0.0 | ||
| 2007 | 0.1 | 0.2 | 0.0 | 0.0 | 0.0 | 0.0 | 0.0 | 0.1 | 0.0 | 0.0 | 0.0 | 0.0 | 0.1 | 0.0 | 0.1 | 0.0 | 0.0 | ||
| 2006 | 0.0 | 0.1 | 0.0 | 0.0 | 0.0 | 0.0 | 0.0 | 0.0 | 0.0 | 0.0 | 0.1 | 0.0 | 0.0 | 0.0 | 0.0 | 0.0 | 0.0 | ||
| 2005 | 0.0 | 0.0 | 0.0 | 0.0 | 0.0 | 0.0 | 0.0 | 0.0 | 0.0 | 0.1 | 0.1 | 0.1 | 0.0 | 0.0 | 0.0 | 0.0 | 0.0 | ||
| 2004 | 0.0 | 0.0 | 0.0 | 0.1 | 0.0 | 0.0 | 0.0 | 0.1 | 0.0 | 0.0 | 0.0 | 0.0 | 0.0 | 0.0 | 0.0 | 0.0 | 0.0 | ||
| 2003 | 0.0 | 0.1 | 0.1 | 0.0 | 0.0 | 0.0 | 0.0 | 0.0 | 0.0 | 0.0 | 0.0 | 0.0 | 0.0 | 0.0 | 0.0 | 0.0 | 0.0 | ||
| 2002 | 0.1 | 0.0 | 0.0 | 0.0 | 0.0 | 0.0 | 0.0 | 0.0 | 0.0 | 0.0 | 0.0 | 0.0 | 0.0 | 0.0 | 0.0 | 0.0 | 0.0 | ||
| 2001 | 0.2 | 0.0 | 0.0 | 0.0 | 0.0 | 0.0 | 0.0 | 0.0 | 0.0 | 0.0 | 0.0 | 0.0 | 0.1 | 0.0 | 0.0 | 0.0 | 0.0 | ||
| 2000 | 0.1 | 0.0 | 0.0 | 0.0 | 0.0 | 0.0 | 0.0 | 0.1 | 0.0 | 0.0 | 0.5 | 0.0 | 0.0 | 0.0 | 0.0 | 0.1 | 0.0 | ||
| 1999 | 0.0 | 0.0 | 0.0 | 0.0 | 0.0 | 0.0 | 0.2 | 0.0 | 0.0 | 0.0 | 0.1 | 0.1 | 0.0 | 0.0 | 0.1 | 0.0 | 0.0 | ||
| 1998 | 0.0 | 0.0 | 0.0 | 0.0 | 0.0 | 0.0 | 0.0 | 0.1 | 0.0 | 0.0 | 0.0 | 0.0 | 0.0 | 0.0 | 0.0 | 0.0 | 0.0 | ||
| 1997 | 0.0 | 0.0 | 0.1 | 0.0 | 0.0 | 0.0 | 0.1 | 0.0 | 0.1 | 0.0 | 0.0 | 0.0 | 0.0 | 0.0 | 0.0 | 0.1 | 0.0 | ||
| 1996 | 0.2 | 0.0 | 0.0 | 0.0 | 0.0 | 0.0 | 0.0 | 0.0 | 0.0 | 0.1 | 0.1 | 0.0 | 0.1 | 0.0 | 0.0 | 0.1 | 0.0 | ||
| 1995 | 0.0 | 0.0 | 0.1 | 0.0 | 0.0 | 0.0 | 0.0 | 0.0 | 0.0 | 0.1 | 0.0 | 0.0 | 0.0 | 0.0 | 0.0 | 0.0 | 0.0 | ||
| 1994 | 0.1 | 0.0 | 0.0 | 0.0 | 0.0 | 0.1 | 0.0 | 0.1 | 0.0 | 0.0 | 0.0 | 0.1 | 0.1 | 0.0 | 0.0 | 0.0 | 0.0 | ||
| 1993 | 0.0 | 0.0 | 0.2 | 0.0 | 0.0 | 0.0 | 0.0 | 0.0 | 0.0 | 0.0 | 0.4 | 0.0 | 0.0 | 0.0 | 0.0 | 0.2 | 0.1 | ||
| 1992 | 0.2 | 0.0 | 0.0 | 0.0 | 0.0 | 0.0 | 0.1 | 0.0 | 0.0 | 0.0 | 0.0 | 0.0 | 0.1 | 0.0 | 0.0 | 0.0 | 0.0 | ||
| 1991 | 0.1 | 0.1 | 0.0 | 0.0 | 0.1 | 0.0 | 0.0 | 0.2 | 0.0 | 0.0 | 0.0 | 0.0 | 0.1 | 0.1 | 0.1 | 0.0 | 0.0 | ||
| 1990 | 0.1 | 0.1 | 0.0 | 0.0 | 0.0 | 0.0 | 0.0 | 0.0 | 0.0 | 0.0 | 0.0 | 0.1 | 0.1 | 0.0 | 0.0 | 0.0 | 0.0 | ||
| 1989 | 0.0 | 0.1 | 0.1 | 0.1 | 0.1 | 0.1 | 0.1 | 0.1 | 0.0 | 0.0 | 0.1 | 0.0 | 0.0 | 0.1 | 0.1 | 0.0 | 0.1 | ||
| 1988 | 0.1 | 0.0 | 0.0 | 0.0 | 0.0 | 0.1 | 0.1 | 0.0 | 0.1 | 0.1 | 0.1 | 0.1 | 0.1 | 0.0 | 0.0 | 0.1 | 0.1 | ||
| 1987 | 0.0 | 0.0 | 0.1 | 0.1 | 0.1 | 0.0 | 0.0 | 0.0 | 0.0 | 0.1 | 0.0 | 0.1 | 0.1 | 0.1 | 0.0 | 0.0 | 0.0 | ||
| 1986 | 0.0 | 0.0 | 0.0 | 0.0 | 0.1 | 0.0 | 0.0 | 0.0 | 0.0 | 0.0 | 0.0 | 0.0 | 0.0 | 0.0 | 0.0 | 0.0 | 0.0 | ||
| 1985 | 0.0 | 0.0 | 0.0 | 0.0 | 0.0 | 0.0 | 0.0 | 0.0 | 0.0 | 0.0 | 0.5 | 0.0 | 0.0 | 0.0 | 0.0 | 0.1 | 0.0 | ||
| 1984 | 0.0 | 0.0 | 0.0 | 0.0 | 0.0 | 0.0 | 0.0 | 0.0 | 0.0 | 0.0 | 0.0 | 0.0 | 0.0 | 0.0 | 0.0 | 0.0 | 0.0 | ||
| 1983 | 0.0 | 0.0 | 0.0 | 0.0 | 0.0 | 0.0 | 0.0 | 0.0 | 0.0 | - | 0.0 | 0.0 | 0.0 | 0.0 | 0.0 | 0.0 | 0.0 | ||
| 1982 | - | 0.0 | - | 0.0 | 0.0 | 0.0 | - | 0.0 | - | 0.0 | - | 0.0 | 0.0 | 0.0 | 0.0 | 0.0 | 0.0 | ||
Reporting rates
Reporting rate is the proportion of all surveys in which the species was present.
Reporting rate by year
This chart shows the reporting rate of Satin Bowerbird each year between 1982 and 2017. 
Reporting rate by month
This chart shows the reporting rate by month of Satin Bowerbird. The blue lines show the reporting rate for the twelve months to June 2017 and the bars show the average reporting rate for the period 1982 to 2017. 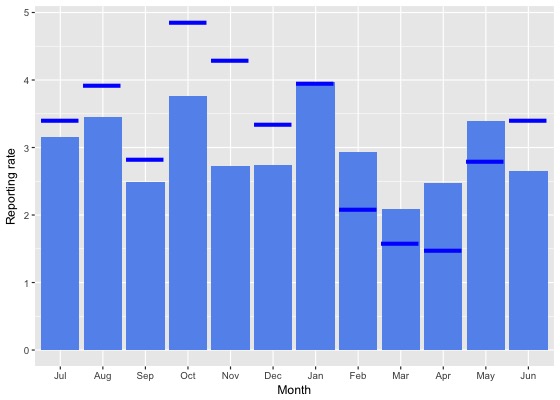
Reporting rate by season
This chart shows the seasonal reporting rate of Satin Bowerbird. The blue lines show the seasonal reporting rate for the twelve months to June 2017 and the bars show the average seasonal reporting rate for the period 1982 to 2017. 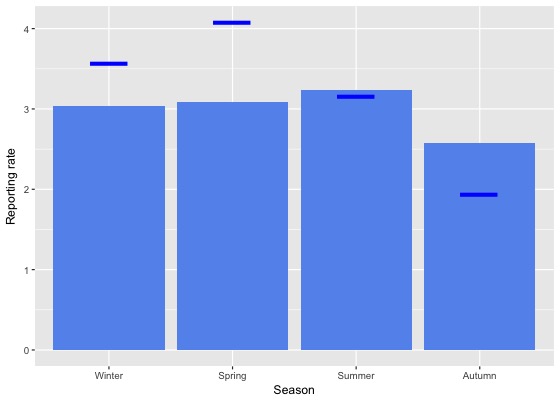
Reporting rate data
| Month | Season | ||||||||||||||||||
|---|---|---|---|---|---|---|---|---|---|---|---|---|---|---|---|---|---|---|---|
| Period | Jul | Aug | Sep | Oct | Nov | Dec | Jan | Feb | Mar | Apr | May | Jun | Winter | Spring | Summer | Autumn | All | ||
| All years | |||||||||||||||||||
| All | 3.2 | 3.4 | 2.5 | 3.8 | 2.7 | 2.7 | 4.0 | 2.9 | 2.1 | 2.5 | 3.4 | 2.7 | 3.0 | 3.1 | 3.2 | 2.6 | 3.0 | ||
| Previous years | |||||||||||||||||||
| All previous years | 3.1 | 3.4 | 2.4 | 3.6 | 2.5 | 2.6 | 4.0 | 3.1 | 2.2 | 2.6 | 3.5 | 2.5 | 2.9 | 2.9 | 3.3 | 2.7 | 3.0 | ||
| Previous 30 years | 3.2 | 3.4 | 2.4 | 3.7 | 2.5 | 2.7 | 4.0 | 3.2 | 2.2 | 2.7 | 3.5 | 2.6 | 3.0 | 3.0 | 3.3 | 2.7 | 3.0 | ||
| Previous 20 years | 2.9 | 3.3 | 2.1 | 3.8 | 2.3 | 2.5 | 4.0 | 3.1 | 1.9 | 2.5 | 3.6 | 2.4 | 2.8 | 2.9 | 3.2 | 2.5 | 2.9 | ||
| 10 year groups | |||||||||||||||||||
| [2007,2017) | 3.4 | 3.7 | 2.3 | 4.1 | 2.2 | 2.6 | 4.2 | 3.0 | 2.2 | 2.4 | 3.6 | 2.6 | 3.1 | 3.1 | 3.3 | 2.6 | 3.1 | ||
| [1997,2007) | 2.1 | 2.3 | 1.8 | 2.7 | 2.3 | 2.4 | 3.5 | 3.3 | 1.4 | 2.6 | 3.7 | 2.0 | 2.1 | 2.2 | 2.9 | 2.4 | 2.4 | ||
| [1987,1997) | 4.0 | 3.9 | 4.1 | 3.1 | 3.3 | 3.7 | 4.0 | 3.6 | 3.6 | 3.7 | 3.3 | 3.4 | 3.8 | 3.4 | 3.8 | 3.6 | 3.6 | ||
| 5 year groups | |||||||||||||||||||
| [2012,2017) | 3.5 | 3.9 | 2.7 | 4.3 | 2.3 | 2.9 | 4.1 | 3.0 | 2.6 | 2.7 | 4.1 | 3.4 | 3.6 | 3.3 | 3.4 | 3.0 | 3.3 | ||
| [2007,2012) | 3.0 | 3.0 | 1.5 | 3.8 | 2.0 | 1.9 | 4.5 | 2.9 | 1.0 | 1.8 | 1.9 | 1.0 | 2.0 | 2.8 | 3.0 | 1.5 | 2.4 | ||
| [2002,2007) | 1.9 | 1.9 | 1.4 | 2.7 | 2.3 | 2.3 | 1.8 | 1.5 | 0.6 | 1.4 | 3.0 | 1.3 | 1.7 | 2.1 | 2.0 | 1.4 | 1.8 | ||
| [1997,2002) | 2.4 | 2.7 | 2.2 | 2.5 | 2.3 | 2.4 | 5.4 | 5.0 | 2.6 | 4.0 | 4.5 | 2.9 | 2.7 | 2.3 | 4.1 | 3.5 | 3.2 | ||
| [1992,1997) | 1.5 | 1.6 | 1.8 | 0.6 | 0.4 | 1.2 | 3.1 | 1.4 | 1.4 | 2.1 | 1.1 | 1.3 | 1.5 | 0.8 | 2.0 | 1.5 | 1.4 | ||
| [1987,1992) | 5.1 | 5.2 | 5.2 | 4.4 | 4.7 | 4.9 | 4.5 | 4.4 | 5.0 | 4.7 | 4.5 | 4.7 | 5.0 | 4.7 | 4.6 | 4.7 | 4.8 | ||
| Year | |||||||||||||||||||
| 2017 | 3.4 | 3.9 | 2.8 | 4.9 | 4.3 | 3.3 | 3.9 | 2.1 | 1.6 | 1.5 | 2.8 | 3.4 | 3.6 | 4.1 | 3.2 | 1.9 | 3.2 | ||
| 2016 | 4.7 | 4.0 | 3.3 | 4.8 | 2.5 | 3.1 | 3.2 | 3.0 | 2.2 | 2.6 | 4.7 | 5.1 | 4.6 | 3.7 | 3.1 | 3.0 | 3.5 | ||
| 2015 | 2.1 | 4.7 | 3.6 | 4.8 | 3.1 | 3.1 | 4.3 | 2.8 | 3.6 | 3.0 | 2.8 | 3.0 | 3.2 | 3.9 | 3.5 | 3.2 | 3.5 | ||
| 2014 | 3.6 | 3.4 | 2.1 | 5.7 | 0.7 | 3.2 | 4.9 | 2.7 | 2.6 | 3.1 | 5.9 | 2.3 | 2.9 | 3.6 | 3.9 | 3.5 | 3.5 | ||
| 2013 | 5.9 | 5.0 | 1.9 | 3.3 | 2.3 | 3.1 | 4.0 | 3.8 | 3.0 | 2.8 | 5.0 | 2.5 | 4.3 | 2.6 | 3.6 | 3.3 | 3.3 | ||
| 2012 | 0.8 | 1.6 | 1.0 | 2.5 | 1.6 | 1.6 | 4.6 | 3.4 | 1.2 | 1.9 | 2.1 | 2.7 | 1.8 | 1.9 | 3.4 | 1.7 | 2.2 | ||
| 2011 | 0.8 | 2.4 | 2.7 | 2.4 | 1.2 | 1.8 | 6.2 | 2.7 | 0.3 | 3.1 | 1.8 | 0.3 | 0.8 | 2.3 | 3.7 | 1.8 | 2.3 | ||
| 2010 | 8.3 | 2.6 | 1.1 | 5.7 | 1.9 | 0.7 | 1.0 | 2.4 | 1.6 | 1.7 | 3.9 | 1.9 | 3.4 | 3.6 | 1.1 | 2.0 | 2.6 | ||
| 2009 | 2.2 | 3.1 | 2.3 | 5.2 | 3.1 | 1.6 | 4.7 | 5.0 | 1.9 | 2.0 | 0.8 | 0.5 | 1.5 | 4.0 | 3.5 | 1.7 | 2.9 | ||
| 2008 | 3.4 | 1.7 | 0.7 | 2.9 | 3.4 | 4.1 | 6.3 | 0.9 | 0.5 | 1.2 | 1.8 | 0.9 | 1.9 | 2.4 | 3.9 | 1.1 | 2.3 | ||
| 2007 | 1.1 | 5.6 | 0.4 | 2.7 | 0.0 | 1.7 | 3.9 | 3.5 | 0.9 | 0.9 | 1.6 | 1.6 | 2.4 | 1.6 | 2.8 | 1.0 | 1.9 | ||
| 2006 | 0.7 | 3.9 | 1.3 | 3.1 | 1.8 | 2.2 | 1.7 | 0.7 | 0.6 | 0.5 | 7.2 | 0.8 | 1.4 | 2.3 | 1.6 | 2.0 | 1.9 | ||
| 2005 | 2.2 | 0.9 | 1.1 | 1.1 | 2.1 | 1.6 | 2.1 | 5.4 | 0.0 | 3.8 | 2.0 | 1.9 | 1.8 | 1.3 | 2.5 | 1.8 | 1.8 | ||
| 2004 | 2.0 | 0.0 | 0.0 | 3.5 | 2.9 | 3.2 | 2.4 | 2.0 | 1.0 | 1.1 | 1.9 | 1.8 | 1.4 | 2.0 | 2.7 | 1.3 | 1.8 | ||
| 2003 | 2.6 | 2.9 | 1.7 | 1.0 | 2.3 | 2.1 | 0.0 | 1.1 | 1.3 | 0.9 | 0.8 | 1.2 | 2.2 | 1.7 | 1.3 | 1.1 | 1.5 | ||
| 2002 | 2.3 | 2.5 | 3.0 | 4.3 | 2.5 | 2.4 | 2.5 | 0.0 | 0.0 | 0.6 | 3.5 | 0.5 | 1.7 | 3.3 | 1.8 | 0.8 | 2.0 | ||
| 2001 | 2.7 | 5.4 | 2.1 | 3.4 | 2.8 | 2.5 | 5.0 | 6.2 | 2.7 | 3.9 | 5.2 | 2.5 | 3.4 | 2.7 | 4.3 | 3.7 | 3.5 | ||
| 2000 | 3.2 | 3.3 | 2.3 | 2.6 | 3.2 | 3.3 | 7.0 | 3.8 | 3.3 | 6.2 | 6.4 | 3.8 | 3.4 | 2.7 | 4.7 | 5.0 | 4.0 | ||
| 1999 | 2.9 | 0.0 | 4.0 | 3.8 | 2.6 | 3.8 | 5.8 | 7.9 | 2.7 | 3.6 | 4.5 | 3.7 | 2.6 | 3.5 | 5.7 | 3.6 | 3.9 | ||
| 1998 | 0.0 | 0.0 | 0.0 | 0.0 | 0.0 | 0.0 | 0.0 | 1.9 | 0.0 | 0.0 | 0.0 | 0.0 | 0.0 | 0.0 | 0.4 | 0.0 | 0.1 | ||
| 1997 | 1.1 | 0.0 | 1.8 | 0.0 | 1.7 | 0.0 | 5.9 | 1.8 | 2.5 | 1.8 | 0.0 | 2.8 | 1.4 | 1.3 | 1.9 | 1.5 | 1.5 | ||
| 1996 | 1.5 | 1.1 | 0.0 | 0.0 | 0.9 | 1.0 | 2.9 | 3.5 | 2.0 | 4.7 | 3.4 | 2.3 | 1.6 | 0.3 | 2.4 | 3.1 | 1.8 | ||
| 1995 | 0.0 | 2.3 | 3.9 | 0.0 | 0.9 | 1.1 | 3.5 | 0.0 | 0.0 | 2.4 | 0.0 | 0.0 | 0.9 | 1.3 | 1.9 | 1.0 | 1.3 | ||
| 1994 | 3.9 | 0.0 | 0.0 | 2.3 | 0.0 | 4.3 | 1.5 | 1.7 | 1.1 | 0.0 | 0.0 | 3.4 | 2.3 | 0.7 | 2.3 | 0.3 | 1.2 | ||
| 1993 | 2.0 | 2.6 | 3.2 | 0.0 | 0.0 | 0.0 | 2.0 | 0.0 | 2.5 | 1.7 | 2.6 | 0.0 | 1.5 | 1.0 | 0.8 | 2.3 | 1.5 | ||
| 1992 | 1.5 | 1.9 | 1.2 | 1.1 | 0.0 | 0.0 | 5.2 | 0.0 | 1.4 | 3.4 | 0.0 | 0.0 | 1.1 | 0.8 | 1.9 | 1.5 | 1.3 | ||
| 1991 | 1.6 | 1.1 | 1.2 | 1.9 | 2.1 | 1.4 | 1.8 | 2.0 | 0.0 | 1.7 | 0.0 | 0.0 | 1.1 | 1.7 | 1.7 | 0.5 | 1.3 | ||
| 1990 | 8.4 | 8.6 | 2.2 | 3.1 | 1.9 | 4.2 | 1.4 | 1.4 | 1.1 | 1.2 | 0.0 | 1.3 | 7.2 | 2.3 | 2.3 | 0.8 | 3.7 | ||
| 1989 | 3.6 | 5.6 | 7.0 | 5.4 | 7.6 | 7.0 | 6.9 | 7.2 | 4.4 | 4.1 | 6.6 | 3.6 | 4.4 | 6.6 | 7.0 | 4.9 | 5.8 | ||
| 1988 | 6.5 | 4.1 | 4.5 | 4.3 | 4.2 | 6.7 | 5.0 | 2.3 | 9.9 | 5.9 | 6.1 | 6.8 | 5.7 | 4.3 | 4.7 | 7.3 | 5.5 | ||
| 1987 | 0.0 | 0.0 | 6.5 | 5.1 | 5.1 | 2.4 | 3.6 | 5.0 | 3.8 | 6.2 | 4.4 | 5.9 | 5.2 | 5.5 | 3.7 | 4.8 | 4.8 | ||
| 1986 | 0.0 | 0.0 | 3.8 | 0.0 | 2.1 | 0.0 | 0.0 | 0.0 | 0.0 | 0.0 | 0.0 | 0.0 | 0.0 | 2.2 | 0.0 | 0.0 | 0.7 | ||
| 1985 | 0.0 | 0.0 | 0.0 | 0.0 | 0.0 | 0.0 | 0.0 | 0.0 | 0.0 | 0.0 | 20.0 | 0.0 | 0.0 | 0.0 | 0.0 | 5.0 | 0.5 | ||
| 1984 | 0.0 | 0.0 | 0.0 | 0.0 | 0.0 | 0.0 | 0.0 | 0.0 | 0.0 | 0.0 | 0.0 | 0.0 | 0.0 | 0.0 | 0.0 | 0.0 | 0.0 | ||
| 1983 | 0.0 | 0.0 | 0.0 | 0.0 | 0.0 | 0.0 | 0.0 | 0.0 | 0.0 | - | 0.0 | 0.0 | 0.0 | 0.0 | 0.0 | 0.0 | 0.0 | ||
| 1982 | - | 0.0 | - | 0.0 | 0.0 | 0.0 | - | 0.0 | - | 0.0 | - | 0.0 | 0.0 | 0.0 | 0.0 | 0.0 | 0.0 | ||
Breeding data
Breeding records by month
Number of breeding records by breeding code and month, 2017 and all years| Breeding code | Jul | Aug | Sep | Oct | Nov | Dec | Jan | Feb | Mar | Apr | May | Jun |
|---|---|---|---|---|---|---|---|---|---|---|---|---|
| 2017 | ||||||||||||
| Breeding (BLA code) | 0 | 0 | 0 | 0 | 0 | 0 | 0 | 0 | 0 | 0 | 0 | 0 |
| Carrying Food | 0 | 0 | 0 | 0 | 0 | 0 | 0 | 0 | 0 | 0 | 0 | 0 |
| Copulating | 0 | 0 | 0 | 0 | 0 | 0 | 0 | 0 | 0 | 0 | 0 | 0 |
| Display | 0 | 1 | 0 | 1 | 0 | 0 | 1 | 0 | 0 | 1 | 2 | 1 |
| Dependent young | 1 | 0 | 0 | 1 | 0 | 0 | 3 | 2 | 0 | 0 | 0 | 0 |
| Faecal sac | 0 | 0 | 0 | 0 | 0 | 0 | 0 | 0 | 0 | 0 | 0 | 0 |
| Inspecting hollow | 0 | 0 | 0 | 0 | 0 | 0 | 0 | 0 | 0 | 0 | 0 | 0 |
| Nest building | 0 | 2 | 0 | 1 | 0 | 0 | 0 | 0 | 0 | 0 | 0 | 0 |
| Nest with eggs | 0 | 0 | 0 | 0 | 0 | 0 | 0 | 0 | 0 | 0 | 0 | 0 |
| Nest with young | 0 | 0 | 0 | 0 | 1 | 1 | 1 | 0 | 0 | 0 | 0 | 0 |
| On/leaving nest | 0 | 0 | 0 | 0 | 0 | 2 | 0 | 0 | 0 | 0 | 0 | 0 |
| All years | ||||||||||||
| Breeding (BLA code) | 0 | 0 | 1 | 0 | 2 | 2 | 0 | 1 | 0 | 0 | 0 | 1 |
| Carrying Food | 2 | 0 | 0 | 0 | 0 | 2 | 4 | 0 | 1 | 0 | 0 | 0 |
| Copulating | 0 | 0 | 0 | 0 | 0 | 0 | 0 | 0 | 0 | 0 | 0 | 0 |
| Display | 0 | 4 | 4 | 9 | 2 | 0 | 1 | 0 | 0 | 1 | 3 | 3 |
| Dependent young | 1 | 0 | 0 | 2 | 0 | 0 | 6 | 3 | 1 | 0 | 0 | 0 |
| Faecal sac | 0 | 0 | 0 | 0 | 0 | 0 | 0 | 0 | 0 | 0 | 0 | 0 |
| Inspecting hollow | 0 | 0 | 0 | 0 | 0 | 0 | 0 | 0 | 0 | 0 | 0 | 0 |
| Nest building | 0 | 2 | 1 | 4 | 2 | 4 | 0 | 0 | 0 | 0 | 0 | 2 |
| Nest with eggs | 0 | 0 | 0 | 0 | 0 | 0 | 0 | 0 | 0 | 0 | 0 | 0 |
| Nest with young | 0 | 0 | 0 | 0 | 1 | 3 | 6 | 0 | 0 | 0 | 0 | 0 |
| On/leaving nest | 0 | 0 | 0 | 0 | 4 | 9 | 2 | 0 | 0 | 0 | 0 | 0 |
Breeding records by year
Average number of breeding records per period by breeding code| Period | Breeding (BLA code) | Carrying Food | Copulating | Display | Dependent young | Faecal sac | Inspecting hollow | Nest building | Nest with eggs | Nest with young | On/leaving nest |
|---|---|---|---|---|---|---|---|---|---|---|---|
| All years | |||||||||||
| All | 0.2 | 0.2 | 0.0 | 0.8 | 0.4 | 0.0 | 0.0 | 0.4 | 0.0 | 0.3 | 0.4 |
| Previous years | |||||||||||
| All previous years | 0.2 | 0.3 | 0.0 | 0.6 | 0.2 | 0.0 | 0.0 | 0.3 | 0.0 | 0.2 | 0.4 |
| Previous 30 years | 0.2 | 0.3 | 0.0 | 0.7 | 0.2 | 0.0 | 0.0 | 0.4 | 0.0 | 0.2 | 0.4 |
| Previous 20 years | 0.3 | 0.4 | 0.0 | 0.9 | 0.2 | 0.0 | 0.0 | 0.6 | 0.0 | 0.3 | 0.7 |
| 10 year groups | |||||||||||
| [2007,2017) | 0.1 | 0.7 | 0.0 | 1.8 | 0.3 | 0.0 | 0.0 | 0.9 | 0.0 | 0.6 | 1.0 |
| [1997,2007) | 0.6 | 0.1 | 0.0 | 0.1 | 0.1 | 0.0 | 0.0 | 0.2 | 0.0 | 0.1 | 0.3 |
| [1987,1997) | 0.0 | 0.1 | 0.0 | 0.1 | 0.2 | 0.0 | 0.0 | 0.1 | 0.0 | 0.0 | 0.0 |
| 5 year groups | |||||||||||
| [2012,2017) | 0.2 | 1.4 | 0.0 | 3.0 | 0.4 | 0.0 | 0.0 | 1.4 | 0.0 | 1.2 | 1.8 |
| [2007,2012) | 0.0 | 0.0 | 0.0 | 0.6 | 0.2 | 0.0 | 0.0 | 0.4 | 0.0 | 0.0 | 0.2 |
| [2002,2007) | 0.2 | 0.2 | 0.0 | 0.2 | 0.2 | 0.0 | 0.0 | 0.4 | 0.0 | 0.2 | 0.2 |
| [1997,2002) | 1.0 | 0.0 | 0.0 | 0.0 | 0.0 | 0.0 | 0.0 | 0.0 | 0.0 | 0.0 | 0.4 |
| [1992,1997) | 0.0 | 0.0 | 0.0 | 0.0 | 0.0 | 0.0 | 0.0 | 0.0 | 0.0 | 0.0 | 0.0 |
| [1987,1992) | 0.0 | 0.2 | 0.0 | 0.2 | 0.4 | 0.0 | 0.0 | 0.2 | 0.0 | 0.0 | 0.0 |
| Year | |||||||||||
| 2017 | 0.0 | 0.0 | 0.0 | 7.0 | 7.0 | 0.0 | 0.0 | 3.0 | 0.0 | 3.0 | 2.0 |
| 2016 | 1.0 | 4.0 | 0.0 | 3.0 | 1.0 | 0.0 | 0.0 | 3.0 | 0.0 | 6.0 | 9.0 |
| 2015 | 0.0 | 3.0 | 0.0 | 6.0 | 1.0 | 0.0 | 0.0 | 4.0 | 0.0 | 0.0 | 0.0 |
| 2014 | 0.0 | 0.0 | 0.0 | 5.0 | 0.0 | 0.0 | 0.0 | 0.0 | 0.0 | 0.0 | 0.0 |
| 2013 | 0.0 | 0.0 | 0.0 | 0.0 | 0.0 | 0.0 | 0.0 | 0.0 | 0.0 | 0.0 | 0.0 |
| 2012 | 0.0 | 0.0 | 0.0 | 1.0 | 0.0 | 0.0 | 0.0 | 0.0 | 0.0 | 0.0 | 0.0 |
| 2011 | 0.0 | 0.0 | 0.0 | 1.0 | 0.0 | 0.0 | 0.0 | 0.0 | 0.0 | 0.0 | 0.0 |
| 2010 | 0.0 | 0.0 | 0.0 | 0.0 | 0.0 | 0.0 | 0.0 | 1.0 | 0.0 | 0.0 | 0.0 |
| 2009 | 0.0 | 0.0 | 0.0 | 1.0 | 0.0 | 0.0 | 0.0 | 1.0 | 0.0 | 0.0 | 0.0 |
| 2008 | 0.0 | 0.0 | 0.0 | 0.0 | 0.0 | 0.0 | 0.0 | 0.0 | 0.0 | 0.0 | 1.0 |
| 2007 | 0.0 | 0.0 | 0.0 | 1.0 | 1.0 | 0.0 | 0.0 | 0.0 | 0.0 | 0.0 | 0.0 |
| 2006 | 1.0 | 0.0 | 0.0 | 0.0 | 0.0 | 0.0 | 0.0 | 0.0 | 0.0 | 0.0 | 0.0 |
| 2005 | 0.0 | 0.0 | 0.0 | 1.0 | 0.0 | 0.0 | 0.0 | 1.0 | 0.0 | 0.0 | 0.0 |
| 2004 | 0.0 | 0.0 | 0.0 | 0.0 | 1.0 | 0.0 | 0.0 | 1.0 | 0.0 | 1.0 | 0.0 |
| 2003 | 0.0 | 1.0 | 0.0 | 0.0 | 0.0 | 0.0 | 0.0 | 0.0 | 0.0 | 0.0 | 1.0 |
| 2002 | 0.0 | 0.0 | 0.0 | 0.0 | 0.0 | 0.0 | 0.0 | 0.0 | 0.0 | 0.0 | 0.0 |
| 2001 | 0.0 | 0.0 | 0.0 | 0.0 | 0.0 | 0.0 | 0.0 | 0.0 | 0.0 | 0.0 | 1.0 |
| 2000 | 2.0 | 0.0 | 0.0 | 0.0 | 0.0 | 0.0 | 0.0 | 0.0 | 0.0 | 0.0 | 0.0 |
| 1999 | 3.0 | 0.0 | 0.0 | 0.0 | 0.0 | 0.0 | 0.0 | 0.0 | 0.0 | 0.0 | 0.0 |
| 1998 | 0.0 | 0.0 | 0.0 | 0.0 | 0.0 | 0.0 | 0.0 | 0.0 | 0.0 | 0.0 | 0.0 |
| 1997 | 0.0 | 0.0 | 0.0 | 0.0 | 0.0 | 0.0 | 0.0 | 0.0 | 0.0 | 0.0 | 1.0 |
| 1996 | 0.0 | 0.0 | 0.0 | 0.0 | 0.0 | 0.0 | 0.0 | 0.0 | 0.0 | 0.0 | 0.0 |
| 1995 | 0.0 | 0.0 | 0.0 | 0.0 | 0.0 | 0.0 | 0.0 | 0.0 | 0.0 | 0.0 | 0.0 |
| 1994 | 0.0 | 0.0 | 0.0 | 0.0 | 0.0 | 0.0 | 0.0 | 0.0 | 0.0 | 0.0 | 0.0 |
| 1993 | 0.0 | 0.0 | 0.0 | 0.0 | 0.0 | 0.0 | 0.0 | 0.0 | 0.0 | 0.0 | 0.0 |
| 1992 | 0.0 | 0.0 | 0.0 | 0.0 | 0.0 | 0.0 | 0.0 | 0.0 | 0.0 | 0.0 | 0.0 |
| 1991 | 0.0 | 0.0 | 0.0 | 1.0 | 0.0 | 0.0 | 0.0 | 0.0 | 0.0 | 0.0 | 0.0 |
| 1990 | 0.0 | 0.0 | 0.0 | 0.0 | 0.0 | 0.0 | 0.0 | 0.0 | 0.0 | 0.0 | 0.0 |
| 1989 | 0.0 | 0.0 | 0.0 | 0.0 | 2.0 | 0.0 | 0.0 | 1.0 | 0.0 | 0.0 | 0.0 |
| 1988 | 0.0 | 0.0 | 0.0 | 0.0 | 0.0 | 0.0 | 0.0 | 0.0 | 0.0 | 0.0 | 0.0 |
| 1987 | 0.0 | 1.0 | 0.0 | 0.0 | 0.0 | 0.0 | 0.0 | 0.0 | 0.0 | 0.0 | 0.0 |
| 1986 | 0.0 | 0.0 | 0.0 | 0.0 | 0.0 | 0.0 | 0.0 | 0.0 | 0.0 | 0.0 | 0.0 |
| 1985 | 0.0 | 0.0 | 0.0 | 0.0 | 0.0 | 0.0 | 0.0 | 0.0 | 0.0 | 0.0 | 0.0 |
| 1984 | 0.0 | 0.0 | 0.0 | 0.0 | 0.0 | 0.0 | 0.0 | 0.0 | 0.0 | 0.0 | 0.0 |
| 1983 | 0.0 | 0.0 | 0.0 | 0.0 | 0.0 | 0.0 | 0.0 | 0.0 | 0.0 | 0.0 | 0.0 |
| 1982 | 0.0 | 0.0 | 0.0 | 0.0 | 0.0 | 0.0 | 0.0 | 0.0 | 0.0 | 0.0 | 0.0 |
Distribution map
Distribution - 2017
This map shows the observed distribution of the Satin Bowerbird for 2017.
The red circles are the grid cells where Satin Bowerbird have been reported.
The transparency of the red circles indicate how many surveys sheets were submitted for that grid cell; the darker the red the more reliable the data. Of the 315 grid cells with reports, 83 had only one sheet; an example is grid number A9.
The size of the circle represents the reporting rate. The maximum reporting rate for Satin Bowerbird was 100.0% (eg grid number A9) and the minimum was 0.2% (eg grid number J12). 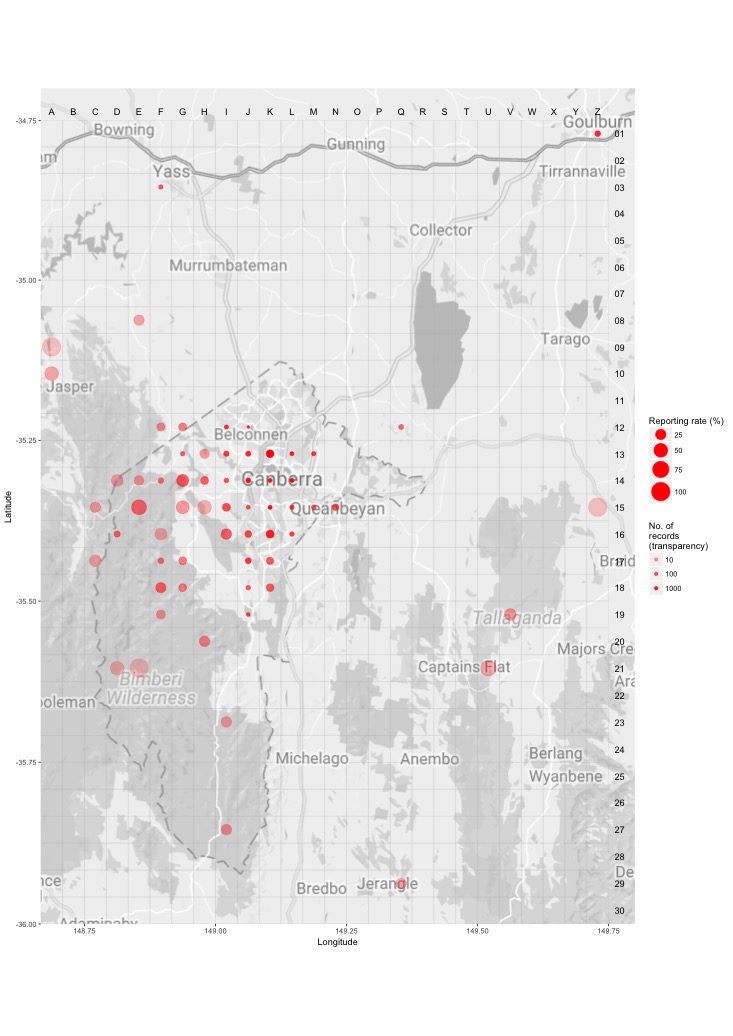
Distribution - all years
This map shows the observed distribution of the Satin Bowerbird for all years.
The red circles are the grid cells where Satin Bowerbird have been reported.
The transparency of the red circles indicate how many surveys sheets were submitted for that grid cell; the darker the red the more reliable the data. Of the 703 grid cells with reports, 55 had only one sheet; an example is grid number B13.
The size of the circle represents the reporting rate. The maximum reporting rate for Satin Bowerbird was 100.0% (eg grid number B13) and the minimum was 0.0% (eg grid number L11). 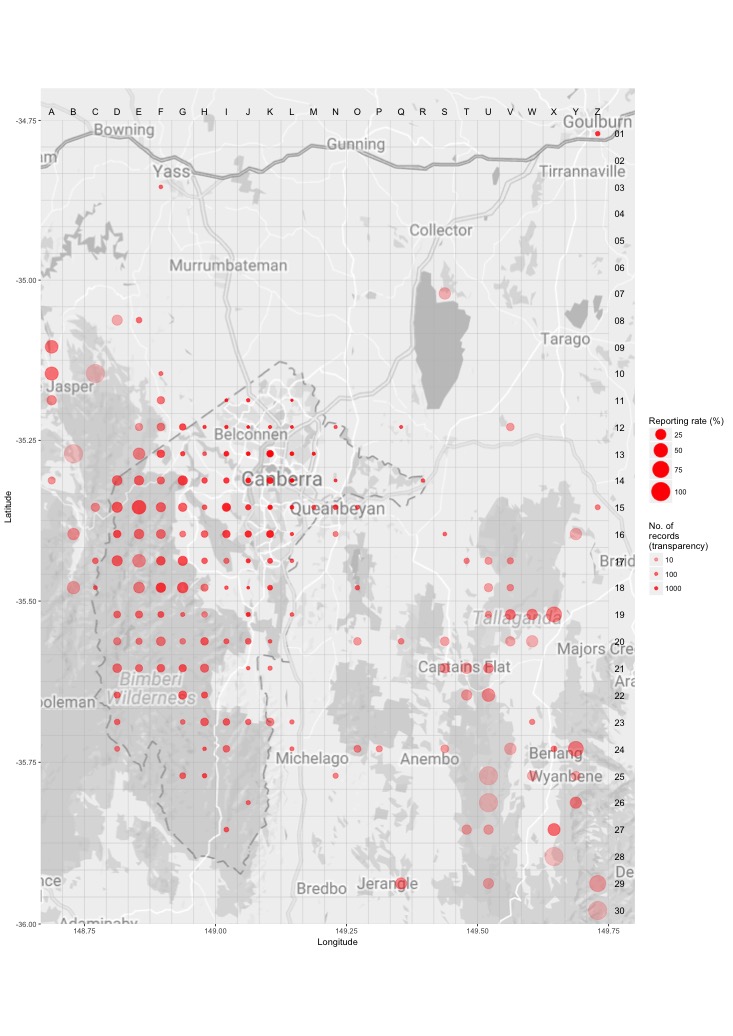
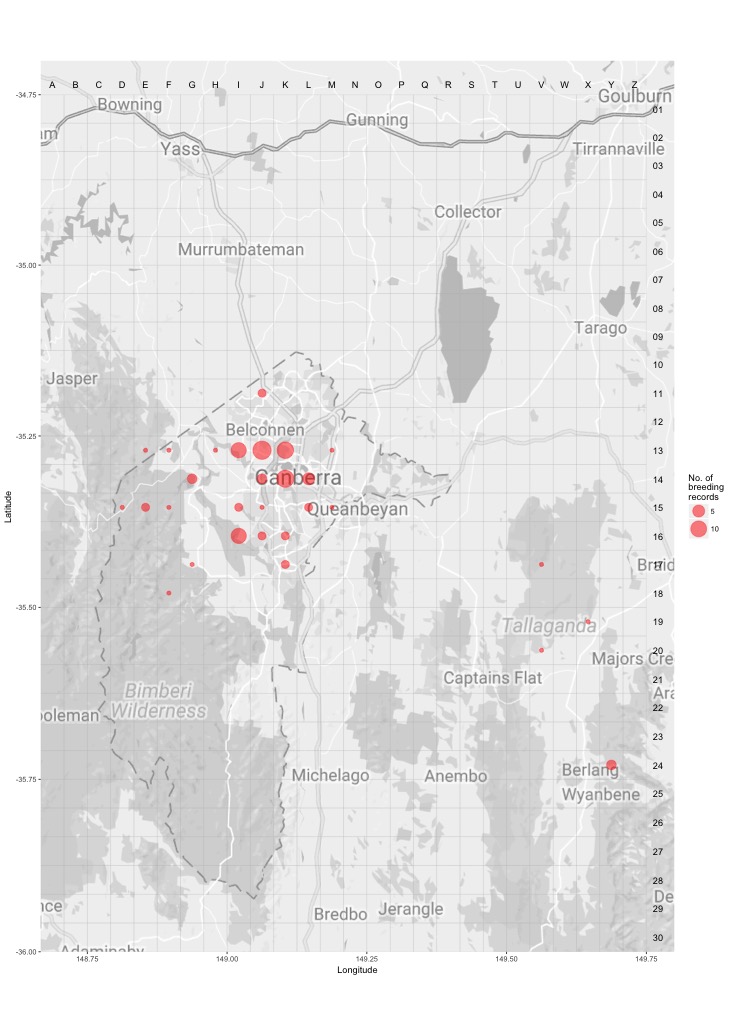
Breeding map
Breeding - 2017
This map shows the breeding distribution of the Satin Bowerbird for 2017.
The red circles are the grid cells where breeding activity for Satin Bowerbird have been reported.
The size of the circle represents the number of reports. 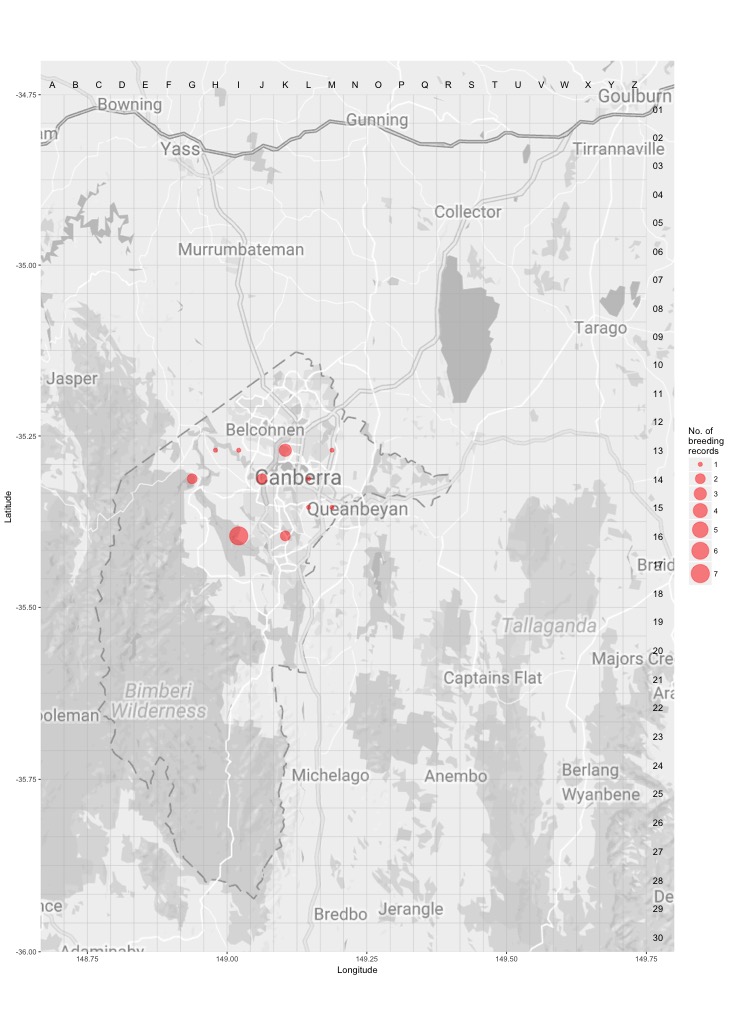
Breeding - all years
This map shows the breeding distribution of the Satin Bowerbird for all years.
The red circles are the grid cells where breeding activity for Satin Bowerbird have been reported.
The size of the circle represents the number of reports.